


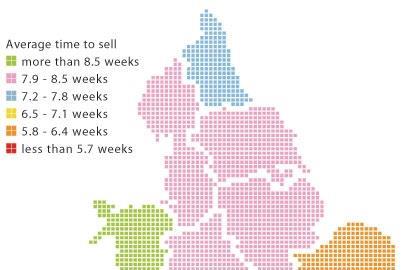
Housing demand heads back South
“If you looked back at a similar map in 2004 you would have seen these colours reversed,” says Richard Donnell, director of research at property data company Hometrack. According to him, three years ago properties in the North and Midlands were being snapped up and London was heading for the doldrums of 2005. “But now London and the South are bouncing back with a lack of supply driving the shorter time to sell here,” he adds. “The northern market has seen strong growth in recent years fuelled by strong public sector employment growth. However, there is now more supply than demand.”
Hometrack’s analysis is reflected in the most recent house price data published by the DCLG. This showed that annual house price inflation in the capital in January was 13.2% while the East and West Midlands both saw their corresponding prices rise by 7.6%. However, the trend was bucked slightly by the North-west and Yorkshire and the Humber where prices soared by 11.1% and 10.7% respectively.
The government’s prediction ina separate study that by 2029 there will be 223,000 more households in England is worrying, but planners should be able to take comfort from the fact that the North and Midlands will account for 70% of household growth until 2026. According to the DCLG, the key reason for this is that most of the 155,000 new single-person households will be in these regions.
The Home Builders Federation has taken these findings as its cue to lambast the government and local authorities for failing to provide enough land to build the homes for all th new households. Its point will not be lost on ministers that the DCLG’s identification of 45 “housing growth points” last year to deal with this long-term growth in demand for homes is already seen as insufficient.
Source
RegenerateLive

No comments yet