


Ian Goodridge and Christian Betts of Arcadis unpack the latest trends in international construction costs as we move into what is likely to be a pivotal moment in the recovery of the sector globally
01 / Introduction
Despite the socio-economic and political upheaval in 2023, construction markets globally experienced relative calm compared with the previous two years, as demand eased and supply chains returned to a more level footing. High borrowing costs and weak demand for housing were common aspects of many construction markets and tended to undercut the positive impact of post-pandemic recovery-led infrastructure investment.
Looking ahead, 2024 is likely to be a pivotal moment in the recovery of the global construction sector. Finance-led markets such as housing and commercial, together with energy transition investment to meet net zero goals, should start to see a gradual uptick as interest rates fall to more manageable levels.
However, the speed of recovery could be impacted by a race for capacity, as the notable 2023 trend for rapid expansion of investment in technology assets and data centres looks set to continue. This will place a premium on productivity-led design, procurement and construction to address any ongoing affordability challenges.
02 / The cost index snapshot
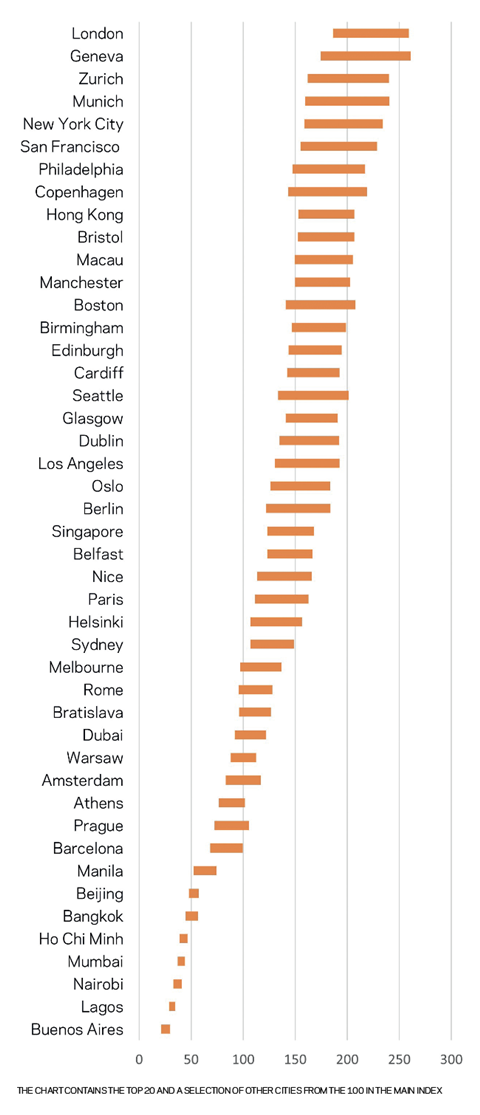
The Arcadis ICC index for 2024 covers 100 locations, with data collected in the first quarter of 2024. Projects delivered in accordance with local specification standards are compared on the basis of a currency conversion to US dollars.
The main positive for ICC 2024 is that the scourge of high inflation has mostly been eliminated. Just a few markets saw double-digit inflation during 2023, although more than 25 cities recorded price increases of over 5%. Price hikes in the US and the UK lagged at 2%-3% while some markets, notably China and – for the second year in a row – the Netherlands, saw falling prices.
London has regained the top spot, swapping places with Geneva in second. In addition to inflation at 2%-3%, the change was driven by a mix of UK regulations focused on low carbon emissions and improved building safety, together with clients seeking high-end specification enhancement, particularly in sub-sectors such as offices and hotels. This resulted in all the UK cities in the index rising in 2024, including Bristol, which entered the top 10 for the first time, up from 13th last year.
Another factor was sterling strengthening against the US dollar, especially since the start of 2024, while many other currencies have weakened against the US benchmark. This was notable at the bottom of the rankings, where Lagos and Buenos Aires both experienced a collapse in the value of local currency versus the US dollar and so slipped down the rankings, despite high inflation levels.
Perennial European construction cost hot spots Copenhagen and Zurich stayed high in the rankings. Philadelphia was a new entrant in the top 10 last year and has risen now to seventh, just behind US compatriots New York City and San Francisco, due mainly to 5%-plus inflation in the city, against 2%-4% typically in the US. Markets continued to stagnate in the Netherlands; Amsterdam, our datum location, fell to 65th place.
The two main market trends in the ICC index this year are:
- Local inflation proved to be the major factor determining changes in ranking in the 2024 ICC index.
- In a reversal of a trend of the previous two years, very little movement in 2023 was driven by currency fluctuation. Exceptions included the UK cities – where index values were boosted around 2% by currency effects – and those in Australia and New Zealand, where 12-month currency falls of 8% and 5% respectively against the US dollar saw cities fall down the index, despite most experiencing local inflation of over 5%.
Globally, accelerated investment cycles associated with energy transition, network investment and real estate decarbonisation could coincide this year with a recovery in cyclical building sectors like housing. As a result, some markets may see accelerating inflation, including China, the Nordics, South East Asia and the US.
Figure 1: International Construction Costs Index 2024
03 / Regional analysis
US
Construction inflation moderated in US cities in 2023, down to an average of 2.7%, from a range of 5%-10% in 2022. While rate-sensitive sectors such as commercial, retail and hospitality all slumped, activity levels were boosted by a major uptick in others, including industrial and infrastructure, which were aided by major government incentives and investment. The CHIPS and Science Act, for example, contributed to a doubling of construction spend on factories in 2023 compared with 2022, totalling nearly $200bn. The computer and electronics segment was the key sector driving this manufacturing construction boom, accounting for 64% of that spend.
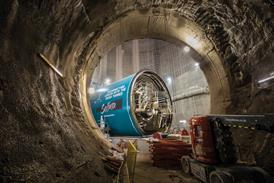
Mega-projects continue to be disruptive to local contracting communities in terms of their impact on availability of local skilled labour, affecting for example the cost and availability of electrical trades in the vicinity of data centre projects. Maintaining workforce engagement and continuity has been a particular challenge in 2023 as the extent of large-scale industrial investment has ramped up.
Tender prices are forecast to average between 3% and 4% across US cities in 2024, boosted by an improvement in housing activity as interest rates begin to fall.
Australia
Viability issues took hold in the construction sector in 2023 as rising construction costs put pressure on project bottom lines, leading to many schemes being delayed or cancelled. The situation was exacerbated by a 31% year-on-year rise in construction company administrations in 2023, leading to suggestions that the industry is facing the toughest conditions in a decade. In the face of difficult markets, clients looked at alternative methods of construction, such as design for manufacture and assembly (DfMA).
Tender price inflation was between 5% and 7% for most Australian cities, as continued investment in transport and social infrastructure provided most of the demand, and data centres and industrial projects put pressure on capacity to deliver.
Through 2024, a strong forward pipeline is set to include growth in housing around new metro stations in Sydney as the new government in New South Wales looks to leverage infrastructure projects to densify city development. And in Brisbane, infrastructure activity will ramp up as Olympic deadlines edge nearer.
China
Construction output in China saw growth of 5.8% in 2023, outstripping the country’s official GDP figures of 5.2% for the whole economy. This was primarily driven by transport infrastructure and industrial projects, which helped to offset a 20% fall in new-build real estate activity as the property market debt crisis and bankruptcies of a number of China’s major real estate developers took hold.
Most Chinese cities in the index saw construction deflation of between 2% and 3% in 2023, as the turmoil surrounding the real estate market continued for a third year. While new construction starts measured by floor area fell 30% year-on-year in January 2024, there is hope that the recent announcement of the largest ever reduction in benchmark mortgage rates will provide stimulus to the property sector for the year ahead. Current forecasts suggest annual construction inflation of 2% to 3% by the end of this year.
New drivers are emerging to shape China’s economic growth. The green transition, urban renewal and industrial upgrading, for example, are creating many new opportunities as efforts to meet targets in China’s decarbonisation roadmap get under way.
>>> Also read: Market forecast: Why prices for goods and services are still set for further increases
>>> Also read: Cost model: Evolving the design and build of community diagnostic centres
EU
Eurostat data shows that construction output by volume was flat in 2023, compared with a rise of 2.6% in 2022 and a 5.8% increase in 2021. Latest forecasts suggest that 2024 could mark the bottom of the cycle, with output by volume likely to be down by 0.5% this year, followed by growth of 1% in 2025.
Germany is the EU’s largest construction market, but activity there decreased by 0.9% in 2023, marking a third successive year of decline. In contrast, the Spanish construction sector grew by 5.6% last year, although this was from a low base, boosted by EU recovery fund investments.
While building material prices stabilised in 2023, the challenging market of the past 18 months has seen a major drop-off in approved building permits. In Q3 2023, there was a 14% year-on-year decline in residential permits issued across the EU, for example.
The sharpest falls in domestic residential permits have been in Austria and Germany, which have seen a 40% drop-off over the past two years. This is in contrast with Spain, where permits have more than doubled in that time.
Recent data shows little improvement for the EU as a whole, suggesting that a further decline in new residential construction is likely in 2024 before recovery starts next year. Indeed, the latest research by Euroconstruct suggests that 2024 will see overall construction activity in Europe contract by 2.1%, impacted by economic uncertainty and tightening credit conditions. However, Ireland is expected to buck that trend, seeing a 4.4% growth in construction output, boosted by a near 8% rise in housing completions.
One sector bright spot in Europe could be infrastructure. EU infrastructure volumes saw moderate growth of 2.4% in 2022 followed by 3.2% growth last year. More of the same is expected in 2024, driven by investments in water and energy transition projects and boosted by the stimulus of Next Generation EU funds.
04 / Insolvencies
One of the themes emerging in many countries is a notable rise in construction company insolvencies and bankruptcies. From the UK to other parts of Europe and further afield from Australia to Canada, the issue has gained more prominence, leading to the potential for supply chain failure rising up the project risk register.
It is worth noting here that the terms “insolvency” and “bankruptcy” are often used interchangeably. While they can mean different things in different countries, the trends are nevertheless similar. The data used in this segment refers to official insolvency figures in the UK, Germany and Australia and to bankruptcy figures in other countries.
Table 1 (right) shows that double-digit annual rises in construction insolvencies or bankruptcies was a feature of many markets in 2023. In Germany, for example, reports suggest that the country’s builders are facing an abyss, as a mix of higher borrowing costs and tighter environmental legislation has seen insolvency among construction firms rise by 16% across the year. There was an even starker rise in France and the Netherlands, which saw annual construction bankruptcies increase by 40% or more during 2023.
Table 1: Levels of construction industry bankruptcy in Europe and beyond, 2022 to 2023
| 2022 | 2023 | Change | |
|---|---|---|---|
| Netherlands | 340 | 479 | 41% |
| France | 8,404 | 11,735 | 40% |
| Germany | 1,905 | 2,216 | 16% |
| Belgium | 1.953 | 2,230 | 14% |
| UK | 4,355 | 4,572 | 5% |
| Spain | 803 | 763 | -5% |
| Australia | 919 | 1,541 | 68% |
| Canada | 519 | 681 | 31% |
In the UK, the combined total of construction insolvencies for England, Wales and Scotland last year was 4,572 – the highest in over a decade and 44% above the long-term trend since 2015. The numbers jumped 59% between 2021 and 2022 and were up a further 5% in 2023.
There could be yet more to come, too, with the latest Red Flag Alert report from insolvency specialist Begbies Traynor showing that in Q4 2023 there were nearly 8,000 UK construction companies in “critical” financial distress – often a precursor to formal insolvency – a quarterly rise of 33%. A further 83,000 firms were in “significant” financial distress, suggesting worse is to come before respite from lower inflation rates and predicted falls in interest rates later in the year.
The figures in most of the countries tell a similar tale in terms of causation, with the construction sector being particularly badly hit by a cocktail of rising material and labour costs, and the impact of higher interest rates on both project viability and debt servicing. To the mix can also be added stricter environmental laws in some countries. In our analysis, the only country to buck the trend was Spain. Here a 5% fall in construction company insolvencies was recorded in 2023, although this did follow a 34% annual rise in 2022.
However, construction insolvency rates in the UK and Belgium were already rising in the years before covid-19, then rose faster compared with most European peers immediately after the pandemic, although levels in other countries such as France and the Netherlands are now catching up more quickly. While most of the companies affected by insolvency will be micro-SMEs, the data is emblematic of an industry that is exposed to low margins and unpredictable cash flow. However, identifying businesses at risk is difficult, particularly during project procurement, and often the response from companies is to take an insular approach, even though hardening commercial behaviours in the supply chain can often add to market pressures. In reality, navigating the industry challenge of increasing insolvency rates requires everyone involved, from clients through to contractors and the materials supply chain, to play their part in addressing a collective problem.
About the Construction Costs Index
The Arcadis International Construction Cost Index offers a comparison of building costs across 100 global cities. The report provides regional construction market insights and highlights examples of investment priorities in major cities around the world. This article includes data for 45 cities. The full report, published in April 2024, can be accessed via arcadis.com.
The index is based on a survey of construction costs of 20 building types, based on local specifications and denominated in US dollars to enable comparison. The index compares the costs of delivering a building function in different locations rather than a like-for-like comparison of the costs of a similar type of work.
05 / Currency trends
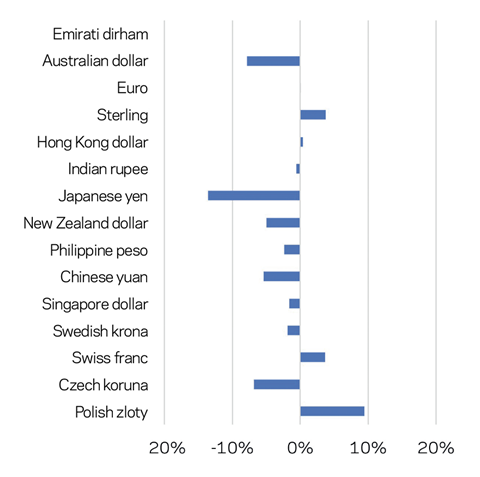
As highlighted above, currency movement against the US dollar was much less of a factor in the final ICC rankings for 2024, compared with the previous two years. That said, a strong British pound did influence the position of all UK cities in the index, while a fall of around 8% in the Australian dollar versus the US benchmark saw Antipodean cities fall in the index, despite many experiencing construction inflation of over 5%.
The chart plots the movement of a range of currencies relative to the US dollar. In the 12 months to the end of February 2024, sterling and the Swiss franc appreciated by almost 4%. In contrast, the Chinese yuan fell by nearly 5.5% and the Australian dollar by close to 8% as bounce-backs from covid years stalled and investors saw the US dollar as a safe haven in times of market stress. Most analysts expect the Australian dollar to recover slightly against its US counterpart during this year.
Figure 2: US$ movement against other currencies, February 2023 to February 20224 (%)
06 / Commodities and energy prices
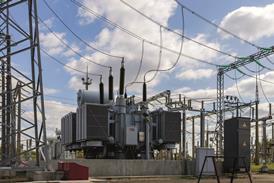
Following record highs in 2022, wholesale electricity prices fell in many countries during 2023 – but there were notable regional differences. The International Energy Agency (IEA) reported in January 2024 that while prices in Europe declined by more than 50% last year, they were still roughly double the levels of 2019. In contrast, wholesale electricity prices in the US were only about 15% higher than in 2019. The implication of the IEA’s findings is that the competitiveness of EU energy-intensive industries will fall, given electricity prices paid by firms were almost double those for their peers in the US and China. The price gap that existed before the energy crisis has widened further.
The IEA reported that falling electricity consumption in advanced economies restrained growth in global power demand in 2023. World demand for electricity grew by 2.2% in 2023, less than the 2.4% rise seen in 2022. While China, India and numerous countries in South East Asia experienced robust growth in electricity demand in 2023, advanced economies posted substantial declines due to a lacklustre macroeconomic environment and high inflation, which reduced manufacturing and industrial output.
Figure 3: Commodity price indices, 2020 to 2024
Looking ahead, one notable point from the IEA is that electricity consumption from data centres, artificial intelligence (AI) and the cryptocurrency sector could double by 2026. Data centres are significant drivers of growth in electricity demand in many regions. After globally consuming an estimated 460TWh in 2022, data centres’ total electricity consumption could reach more than 1,000TWh in 2026, roughly equivalent to the electricity consumption of Japan.
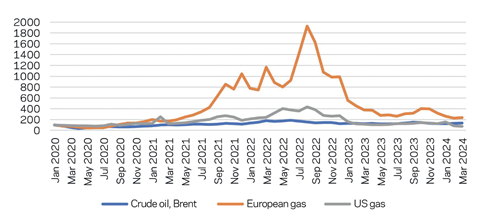
For natural gas, European prices plunged in 2023 after record highs of 2022, aided by lower demand in Europe, weak production in the industrial sector and plentiful supplies of LNG. The momentum continued into the early part of 2024, with the price of TTF, Europe’s natural gas price benchmark, dropping to pre-energy-crisis levels. While it has since risen by 20% as supplies tightened due to maintenance at a major US export facility, recent data suggests Europe has ended the winter season with almost 60% of storage capacity full – a record level for this time of year. The World Bank predicts a shallow price decline of 4% in 2024 as demand slows further.
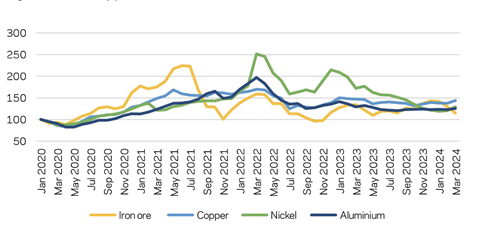
Meanwhile, latest forecasts from the World Bank suggest commodity prices fell by 24% in 2023 and will fall 4% in 2024, as subdued global trade and continued weakness in China’s property sector weigh on energy and industrial metals. However, an uptick in global growth, together with energy transition investment in renewables, should lead to a rebound in commodity prices in 2025, driven by a surge in demand for copper, lithium and nickel, in particular.
Chinese factors affected copper and aluminium prices too. China uses about 70% of world copper supply for its manufacturing and construction industries. Predictions a year ago that copper prices would surge to a record high in 2023, boosted by an expected bounce in the Chinese economy, failed to materialise, with prices at the end of 2023 up just 3% on a year earlier. However, various restrictions on supply are starting to impact copper prices in 2024. They are up 10% since the start of the year, recently reaching a 15-month high of US$9,523 per tonne, and are forecast to rise further in the next three years.
For aluminium, the London Metals Exchange price was down about 7% on an annual basis at the start of December 2023, with China’s slow recovery from covid lockdowns and sluggish growth in Europe and the US all contributing. Prices fell to a 2023 low of US$2,109/t in mid-December but have since rallied, with recent forecasts an average of $3,250/t by 2026.
Figure 4: Energy commodity price indices, 2020 to 2024
07 / Conclusion
There was a sense of normality returning to construction markets in 2023, with the turmoil of the covid pandemic and instability from the Ukraine conflict now diminished and construction inflation levelling out at low single-digit levels on average, although still above long-term trends. Something to watch out for in 2024 is the increased tensions in the Middle East, with any escalation in conflict likely to lead to pressure on energy prices and potential delays to material import delivery schedules.
While the tight labour markets that we talked about last year are still in evidence in many countries, the pressure is easing slightly in others. Instead, the issue of construction insolvency is rising up the agenda for many clients and their teams, in countries ranging from Europe to North America and Australasia. While the tendency in such instances is to harden commercial terms, instead treating the supply chain fairly and viewing them as important assets in the success of a project or programme is likely to lead to better outcomes for clients and contractors alike.


No comments yet