


Software developed by BRE lets designers calculate a development’s energy demand and then work out the most effective combination of renewables to satisfy demand. Matt Dickinson test drives it
A software program that allows a building’s form, renewable technologies and microgeneration systems to be mixed and matched to meet its energy needs has been developed by research organisation BRE. Carbon Mixer lets designers compare different combinations of energy systems to meet a building’s carbon emissions using a method of carbon accounting that provides the optimal low-carbon solution for a scheme for any local climate.
It will allow designers to provide clients with a consistent, reliable and robust approach to designing energy strategies for new developments using the lean, clean, green hierarchy and allows the building and its energy systems to be considered as a whole.
To use the software the designer first calculates the energy demands for a building using standard benchmark figures, Part L SAP calculations or Part L SBEM calculations, as well as thermal modelling if required. At this stage, the user can investigate how the use of insulation, draught proofing and lighting levels can minimise energy demands. Usually, several versions of the same design are modelled and the one nearest Building Regulation requirements is loaded into Carbon Mixer. This becomes the benchmark for future design iterations.
Using this scheme, the software gives the user a visual snapshot of the heat, power and cooling requirements of the development. Those aiming to cut energy use and carbon emissions can gradually enter increasingly efficient low-carbon and renewable energy systems to see how much CO2 can be reduced in comparison with the benchmark.
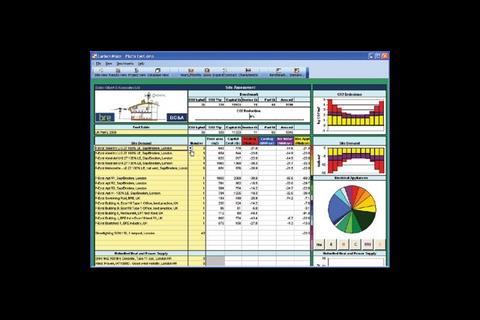
Carbon Mixer’s graphs and pie charts let users instantly see how the mix is working and where its strengths and weaknesses lie. This aspect is particularly useful in discussions with clients and other professionals who do not have relevant technical knowledge. Figure 1 is a screenshot of Carbon Mixer that illustrates how energy demand models for each building have been loaded into the program.
Building characteristic graphs such as in figure 2 show how thermal energy is managed in the building to maintain the comfort levels of occupants. Blocks above the zero line are thermal gains to the building and those below are thermal losses. In this case the solar gains through the windows in summer are being balanced by ventilation losses. If ventilation rates are expected to be difficult to achieve in practice, this graph suggests that improved shading may prevent overheating.
In many cases it is important to have a low-carbon heating system by using efficient boilers that supply heat to community or district heating systems. This might initially be powered by a high-efficiency, gas heating system but could be upgraded to biomass heating or a CHP system that uses gas or biomass. This would fulfill the “clean approach”. The advantage of CHP is that it does not have the transmission losses of grid generation and the associated CO2 emissions.
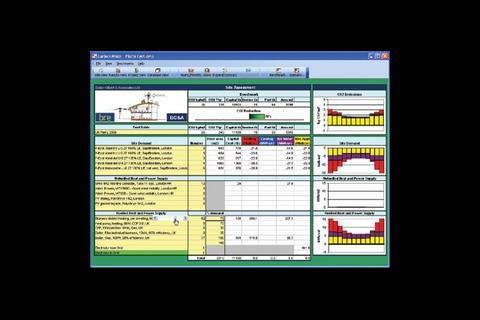
Using the software, BRE and energy software developer BG&A recently worked with developer Terrace Hill and architects Jestico and Whiles on the River Thames Platts Eyot development, which comprises apartments, maisonettes, detached and terraced houses, offices, light industry and a restaurant. The design featured a biomass boiler as the lead unit to supply a heat main to the apartment buildings. Estimates showed this would meet 35% of the energy demand, the rest being met by gas boilers. Figure 3 shows that by increasing the amount of heat provided by the biomass boiler to 70% of the demand (equivalent to having a lead biomass boiler for the whole island development) causes a reduction in CO2 and the histogram of CO2 emissions over 12 months to decrease.
At each stage users can save a snapshot of the scenario to see what the effects of various changes are. Figure 4 shows scenarios that were considered in Platts Eyot: solar hot water systems on the roofs of the maisonettes and terraces, the biomass boiler as described and the combination of the two. The latter resulted in a 16% drop in emissions from the already lean-design buildings. The reductions in carbon emissions so far have been achieved in the areas of heating and hot water. Experimenting with the mix of renewable technologies to provide green electricity can also reduce the emissions associated with electrical appliances.
Graphs show a standardised measure of each renewable technology’s ability to produce energy in a particular climate. For photovoltaic and solar collector panels this is per square metre of panel. For wind turbines it is per square metre of blade-swept area.
Carbon Mixer will also calculate the costs of the various measures to give the user technical information and a business case on which to base the final decision. The program also summarises and breaks down savings associated with each scenario into the saving in fuel and power bills, and savings in annual service and maintenance costs, from which the total annual saving can be provided.
Source
Building Sustainable Design
Postscript
Matt Dickinson is energy consultant at BRE. For more information on the Carbon Mixer, call BRE on 01923 664500 or email: environment@bre.co.uk

No comments yet