Economist Brian Green has been analysing what the latest construction data means for the industry all year - here are the five blogs that caught readers’ attention most in 2012

The point of Brickonomics is to take a hard critical look at the wealth of construction related data and try to make some sense of it all. Sadly, but not surprisingly, that makes it gloomy reading in these days.
One good reason for poking hard at the numbers that describe construction is because they are particularly prone to going up, down and sideways wildly and often in a confusing and contradictory fashion. It’s very easy to be thrown from optimism and despair in the turn of a page.
You can blame the data. You can wag a finger at those who collect and analyse the data. But ultimately what we all want is a clearer more balanced view of where we are and where we are heading.
That’s what Brickonomics strives to do.
When I was presented with this list of the top five best-read Brickonomics blogs I was a bit surprised. They were not particularly gloomier nor were they more optimistic than average.
Topping the list was a tub thumper in reaction to yet more poor output figures. One was a straight analysis piece.
But what pleased me was that three were attempts at getting behind the data to look at how they are put together and what useful but partially hidden meanings might sit behind them.
The numbers that describe construction are prone to going up, down and sideways wildly and often in a confusing and contradictory fashion
So, for example, the analysis of the RICS construction survey started with a rather unexpected rise in optimism. I’m not against optimism, but it seemed a bit out of place given the state of the UK market.
This led me to quiz the survey and the economists at RICS were most helpful. There seems to be potential within the survey for consultants to record their optimism about overseas work done in the UK and, as other data show, UK consulting firms seem to be doing very well overseas.
The RICS construction survey is a pretty good forward indicator of future work on the ground. For that reason I like it.
A first reading of the third quarter survey results might have you think things were getting better in the UK construction market. That is a pleasing thought, but sadly it isn’t necessarily what the figures are telling us.
When I look at the top five picked, they are not necessarily the ones of which I’m most proud.
But those posts sort of sum up what the blog is about. It’s about getting a bit angry about policymakers not understanding the state of construction. It’s about shouting about the awful and (admittedly rarely) the promising data. But most of all it is trying to find a better understanding from the numbers of what is going really going on.
The five most-read Brickonomics blogs of 2012 …
1. UK construction bosses need to make government face the facts: the industry is in freefall
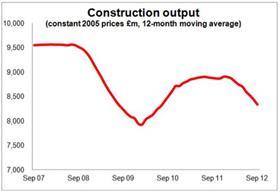
Construction output fell 2.6% in the third quarter of this year. This fall was slightly more than had been expected when the nation’s first estimate of gross domestic product was released.
For informed industry watchers this was no surprise. The fact that revisions by the Office for National Statistics to earlier data pushed the recorded level of output down still further was also not a surprise. click here to read more
2. Some lessons to learn from the downward revisions to construction forecasts
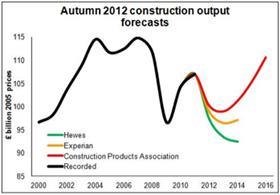
The recession in construction will be longer and deeper than we thought three months ago. That is the message in the latest set of industry forecasts emerging this month.
This may evoke a sense of déjà vu. Each quarter of late the forecasts have darkened. The latest set look pretty bleak as we can see from the graph. click here to read more
3. Construction output continues its rapid decline
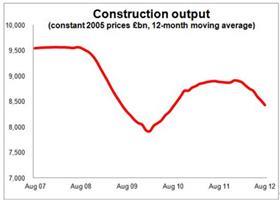
There is no getting away from the fact that the construction output data continue to look increasingly scary.
If we compare month on month the 12-month total output for construction we see the industry over the past three or four months shrinking by about £1bn a month, or put another way about 1%. The graph shows the direction of the annualised output. click here to read more
4. What is the optimism in the latest rics construction survey telling us?
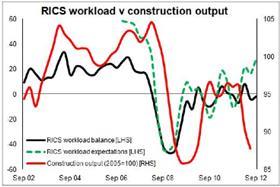
The latest survey of the construction market by the surveyors’ body RICS provides on first reading some confusion, showing optimism rising sharply while workloads fall.
The survey has produced a mildly negative balance for surveyors’ workloads. Yet it also showed expectations of improvement in workload, employment and profit at levels not seen since the recession.
Curious. What lies behind this surge in optimism among surveyors? Are we seeing green shoots? click here to read more
5. Why job shedding in the uk construction industry may be about to accelerate
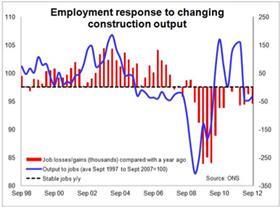
UK construction industry employed about 57,000 fewer people in the third quarter of this year than a year earlier. That’s a drop of about 2.6%.
The ONS data shows that since the peak in September 2007 the fall in the number employed is closer to 380,000. This represents broadly a 15% drop in the workforce. click here to read more


1 Readers' comment