The total activity index stayed steady at its highest level since the referendum, with civil engineering growing especially fast. Orders, prices and employment were all on the rise.
01 / State of play
The total activity index stood at 60, the same as last month: the highest since the referendum in June 2016. Repair and maintenance (R&M) activity grew by nine points to 62 – the first value above 60 since January 2016.
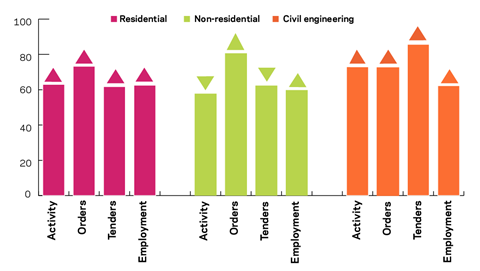
On a sectoral basis, residential activity recorded its fourth month of consecutive growth with an uptick of one point to 63. Non-residential activity fell four points to 58 – still higher than the average for 2017. Civil engineering activity jumped by 13 points to 73 – the highest of the three sectors.
Both orders and tender enquiries recorded growth: orders by six points to 74, and tenders by two points to 62. On a sectoral basis, all three indices grew. Residential orders increased by five points to 73 and non-residential by eight points to 81. The largest rise was in the civil engineering orders index, which jumped by 15 points to 72.
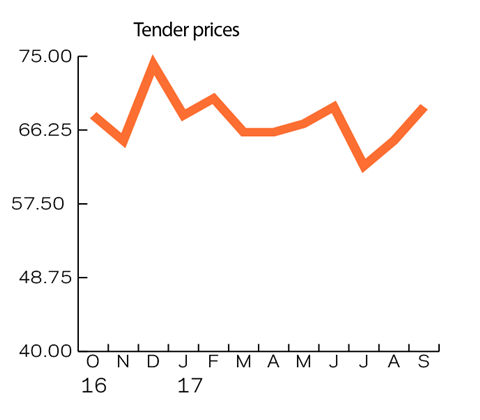
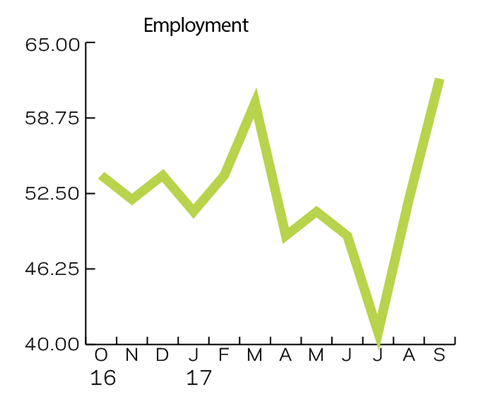
The residential tender enquiries index grew by five points to 62 in September, while the non-residential one fell by three points to 62. The civil engineering index leapt to 86 from 69. The tender prices index increased by four points to 69 from the previous month’s 65 and stays slightly above the average for this year. The employment prospects index saw a 10-point increase to 62 from last month’s 52. The index is up almost 20 points from July’s low.
The October survey shows a similar situation in activity constraints to September’s. The percentage of respondents facing no constraints remained much the same. Insufficient demand remains the most important constraint. Labour shortages also remain a hindrance to growth, but have declined in importance since July. Perhaps the most significant result was that no respondents were facing material or equipment shortages. On the negative side, financial constraints and bad weather, as well as other factors, have increased their influence on the activity of the respondents.
02 / Leading construction activity indicator
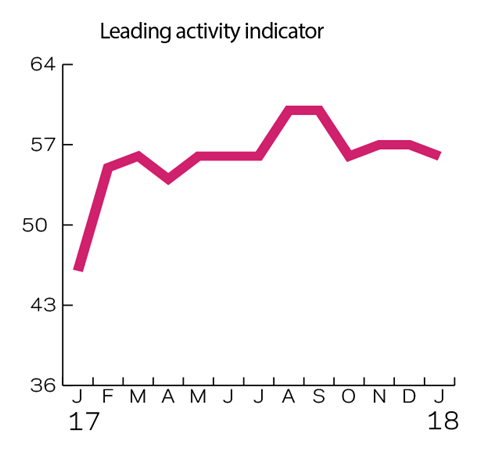
The contractors’ activity index recorded another month of expansion, with the index staying at 60 points, unchanged from last month’s results. The leading activity indicator projects the expansion rate slowing a bit, but still remaining in positive territory – with an average value for the next three months of 57.
03 / Work in hand
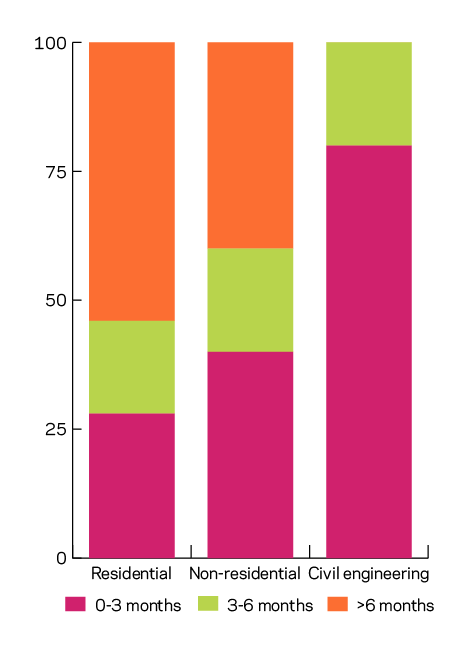
In the residential sector, work in hand figures show improvement from three months ago. More than half of respondents reported having work in hand for more than six months. At the same time the percentage of respondents having work in hand for less than six months has been decreasing since March 2017.
For the non-residential sector, work in hand has been slightly increasing since September 2016, as the percentage of respondents reporting having work in hand for less than six months has decreased somewhat. Unlike in the residential sector, the proportion of respondents in the non-residential sector having work in hand for more than six months is less than 50%.
Unlike the other two sectors, the civil engineering sector seems to be following the opposite trend. Despite some improvements at the beginning of 2017, all respondents report having work in hand for less than six months, with the majority of them having work in hand for less than three months.
04 / Regional perspectives
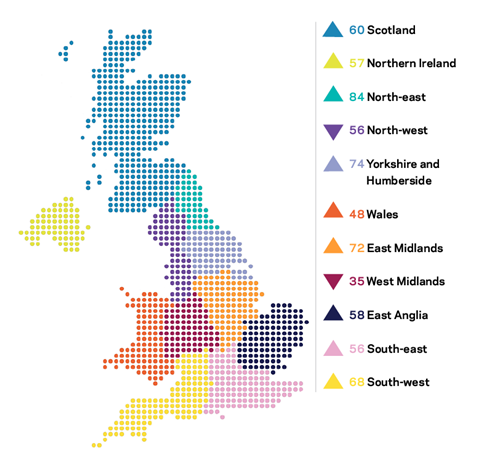
Experian’s regional composite indices incorporate current activity levels, the state of order books and the level of tender enquiries received by contractors to provide a measure of the relative strength of each regional industry.
Please note that due to an issue with the formulas used to calculate the regional indices, we have had to revise the figures for July and August 2017. The movements in indices outlined above are based on the corrected figures.
In September nine of the regions showed positive growth in their indices. A further nine were in expansionary territory. Two regions, the North-west and the West Midlands, saw a decline in their indices. The North-west fell five points to 56, whereas the West Midlands dropped five points to 35. Wales and the West Midlands were the only two regions that reported contractions in September.
Among the other regions, the best performing was the North-east, which saw its index grow three points to 84. The largest increase was for the East Midlands, whose index jumped 10 points to 72.
The UK composite index recorded its third consecutive month of growth. Its index grew by nine points to 72 in September. This is also the highest value since March 2016.
This an extract from the monthly Focus survey of construction activity undertaken by Experian Economics on behalf of the European Commission as part of its suite of harmonised EU business surveys.
The full survey results and further information on Experian Economics’ forecasts and services can be obtained by calling 0207-746 8217 or logging on to www.experian.co.uk/economics
The survey is conducted monthly among 800 firms throughout the UK and the analysis is broken down by size of firm, sector of the industry and region. The results are weighted to reflect the size of respondents. As well as the results published in this extract, all of the monthly topics are available by sector, region and size of firm. In addition, quarterly questions seek information on materials costs, labour costs and work-in-hand.


No comments yet